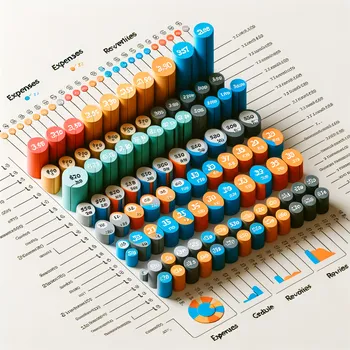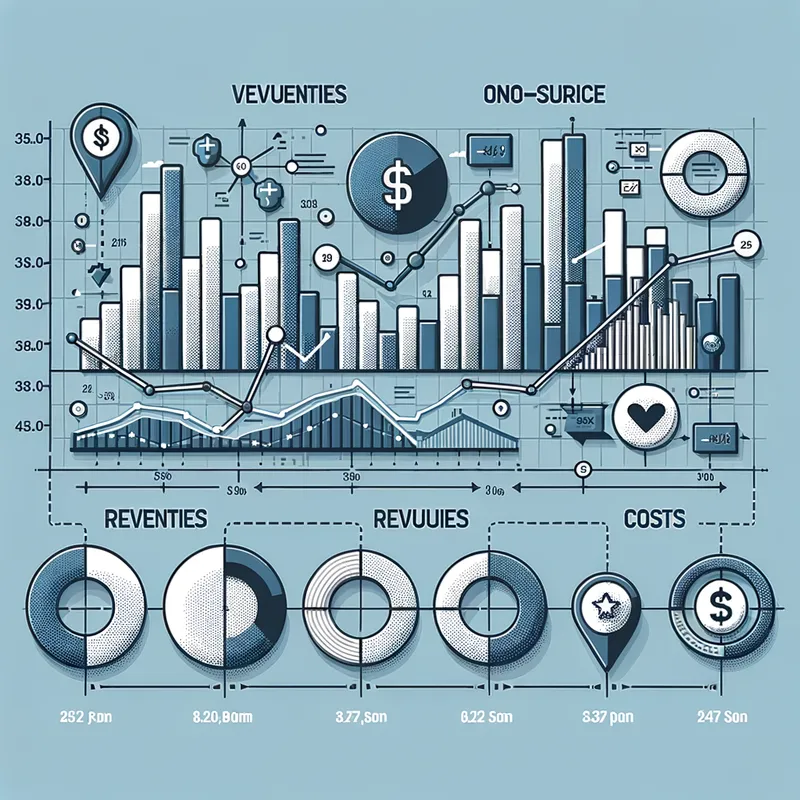
Revenue and Cost Variance
An SVG graphic representing both revenue and cost variances for a chiropractic practice. The diagram includes a dual-axis bar and line chart showcasing the trends and differences in revenues and costs over the past 12 months, with callouts for significant variances.
Art, Size: 1024 x 1024
1 Likes
35 Views