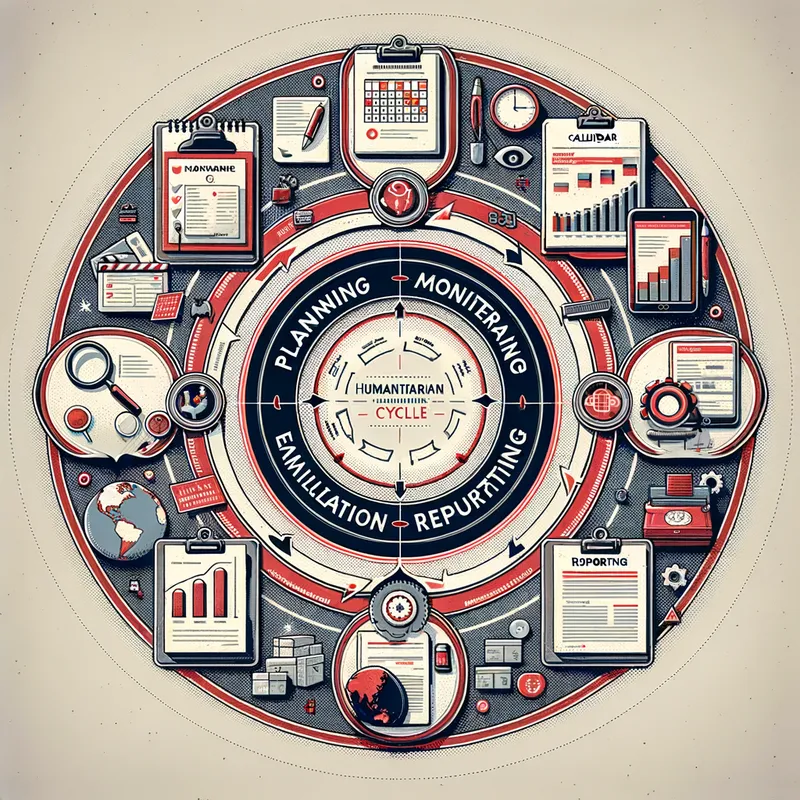
IFRC PMER Cycle Illustration
An intricate infographic illustrating the IFRC Planning, Monitoring, Evaluation, and Reporting (PMER) cycle. The image should clearly depict each stage of the cycle with labeled sections for Planning, Monitoring, Evaluation, and Reporting. Each stage should be visually distinct yet seamlessly integrated into a circular flow, emphasizing the continuous and iterative nature of the process. Use symbols or icons that represent different activities within each stage, such as calendar and checklist for Planning, graph and magnifying glass for Monitoring, clipboard and magnifying glass for Evaluation, and a report or document for Reporting. The color scheme should be professional and engaging, with red, white, and grey tones to align with the IFRC brand identity. Include subtle background elements like a faint globe or map to indicate the global scope of IFRC’s work.