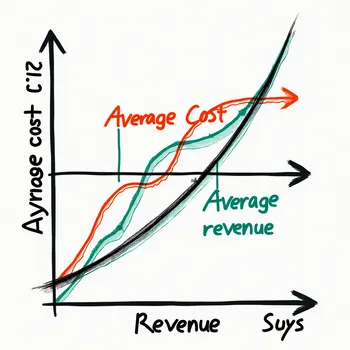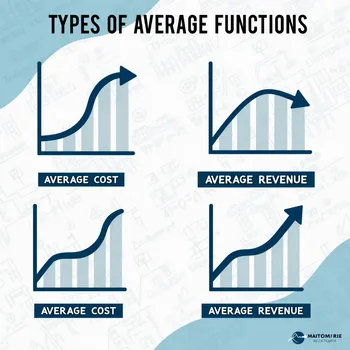
Visual Representation of Average Functions
A detailed graphic showcasing different types of average functions in economics, specifically focusing on average cost and average revenue. The image should feature two main curves: one representing average cost and the other representing average revenue. Use distinct colors for each curve and label them clearly. The background should have a grid design to represent a graph, with appropriately labeled axes for cost/revenue and quantity. Additionally, include visual elements such as data points, arrows, and annotations to highlight key aspects of the average cost and average revenue functions.
Photorealistic 2, Size: 1024 x 1024
2 Likes
98 Views